
Quick answer
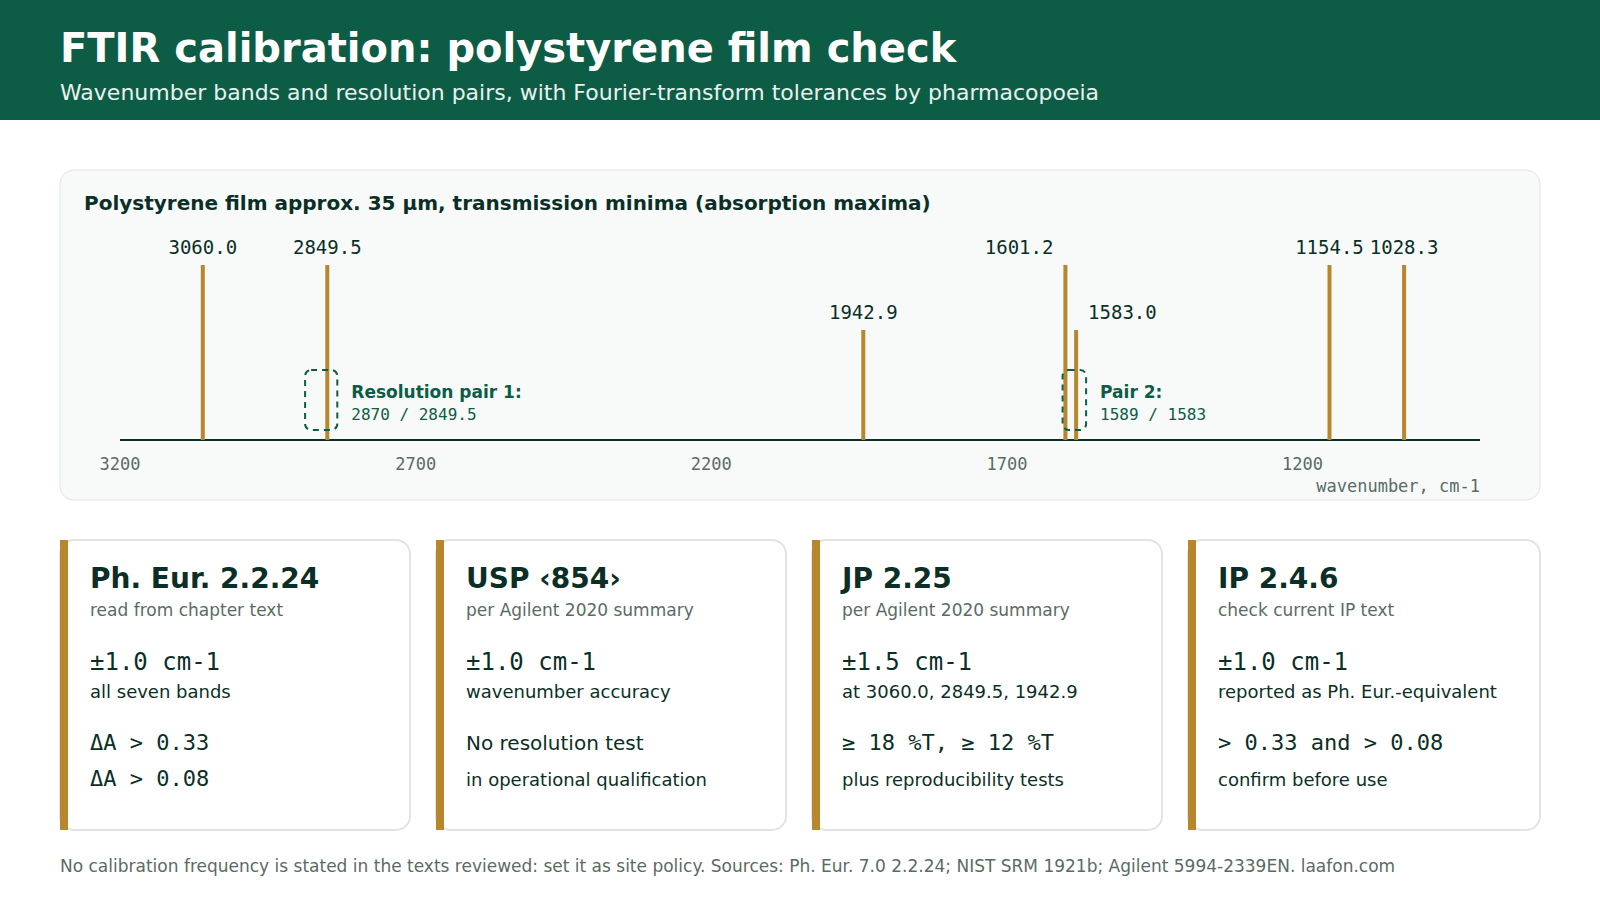
An FTIR spectrophotometer in a pharmaceutical QC laboratory is calibrated with a polystyrene film of about 35 µm: you check the wavenumber scale against seven polystyrene bands and the resolution against two band pairs.
For FTIR calibration as per EP (Ph. Eur. 2.2.24), every one of the seven bands must read within ±1.0 cm-1 on a Fourier-transform instrument, and the absorbance difference must exceed 0.33 between 2870 and 2849.5 cm-1 and 0.08 between 1589 and 1583 cm-1 [1]. USP <854>, the Japanese Pharmacopoeia and the Indian Pharmacopoeia use the same film but not identical test sets, and none of the texts reviewed here fixes a calibration frequency. That interval is your laboratory’s decision.
Six things most calibration pages get wrong
We checked the figures that circulate on Indian pharma blogs and training decks against the pharmacopoeial texts that could be retrieved in full. The European Pharmacopoeia text is the one quoted most, and also the one misquoted most. These six points are where a record built from a blog fails at audit.
- ±1.5 and ±2.0 cm-1 are not FT tolerances. Ph. Eur. Table 2.2.24.-1 has two tolerance columns. The wider values (±1.5 at 3060.0 and 1942.9, ±2.0 at 2849.5 cm-1) belong to monochromator (dispersive) instruments. For Fourier-transform instruments every band is ±1.0 cm-1 [1]. Shimadzu’s note on Ph. Eur. 5.0 records that the FT values at those three bands were tightened from ±1.5 to ±1.0 in that edition [6], so older SOPs may still carry the superseded figure.
- “Greater than 18” and “greater than 10” are not FT resolution limits. Those are percentage-transmittance differences for monochromator instruments. An FT instrument is judged in absorbance: more than 0.33 (2870 against 2849.5 cm-1) and more than 0.08 (1589 against 1583 cm-1) [1]. The Japanese Pharmacopoeia uses a different pair of transmittance limits again: at least 18% and 12% [4].
- No pharmacopoeia reviewed here states how often to calibrate. Ph. Eur. 2.2.24 gives no interval [1]. The International Pharmacopoeia says only that instruments should be “checked frequently” [5]. Monthly, quarterly or before-use checks are site policy, and your SOP should say so rather than cite a chapter for them.
- USP <854> is not Ph. Eur. with a different number. According to Agilent’s 2020 compliance review, the USP chapter asks for wavenumber accuracy in operational qualification, sets no resolution test, and does not require measurement at more than one wavenumber [4]. The USP text itself is subscription-only, so check this against your current USP–NF before you rely on it.
- ATR spectra do not reproduce transmission band positions. The seven reference values are transmission values for a free-standing film. Agilent’s ATR test for Ph. Eur. uses shifted positions (for example 1601.0 and 3059.7 cm-1) and a ratio-based resolution test that Agilent itself labels as its own recommendation [4]. The ATR paragraph of Ph. Eur. 7.0 2.2.24 sets no performance criteria at all [1].
- A library “match score” is not a pharmacopoeial identification result. Ph. Eur. identification requires the bands of the test spectrum to correspond in position and relative size to the reference [1]. A software hit quality such as 922 out of 1000 can support that judgement. It does not replace it.
FTIR calibration as per EP, USP, JP and IP compared
The table puts the four pharmacopoeias side by side for a Fourier-transform instrument in transmission mode. The badge in each row tells you where the figure comes from. compendial means we read the chapter text directly. secondary means it comes from manufacturer compliance documentation because the chapter is paywalled. check source means you must confirm it against the current edition before using it.
| Parameter | Ph. Eur. 2.2.24 / BP App. II A | USP <854> | JP 2.25 | IP 2.4.6 |
|---|---|---|---|---|
| Reference material | Polystyrene film approx. 35 µm compendial [1] | NIST SRM 1921b-traceable polystyrene film, approx. 35 µm, per Agilent’s summary of all four texts secondary [4] | ||
| Wavenumber bands, cm-1 | 3060.0, 2849.5, 1942.9, 1601.2, 1583.0, 1154.5, 1028.3 |
Same seven secondary | Same seven secondary | Same seven check source |
| Wavenumber tolerance, FT | ±1.0 at all seven compendial | ±1.0 secondary | ±1.0; but ±1.5 at 3060.0, 2849.5, 1942.9 secondary |
±1.0 check source |
| Resolution, FT | ΔA 2870–2849.5 > 0.33 ΔA 1589–1583 > 0.08 compendial |
No resolution test in OQ, per Agilent check source | Trough depth 2850→2870 ≥ 18 %T 1583→1589 ≥ 12 %T secondary |
> 0.33 and > 0.08 check source |
| Reproducibility tests | None stated compendial | Not stated in Agilent’s summary | Wavenumber: under 5 cm-1 near 3060, under 1 cm-1 near 1028. Transmittance: under 0.5 % secondary | Not stated in Agilent’s summary |
| Calibration frequency | None stated compendial | Not stated in the sources reviewed. Set it as site policy site policy | ||
Swipe the table sideways on a phone. Ph. Eur. figures are from Ph. Eur. 7.0, chapter 01/2008:20224, and were unchanged in Agilent’s 2020 review. Confirm them against the edition in force at your site.
Two differences matter in daily work. First, JP is the only text in this comparison that adds reproducibility tests. Shimadzu notes that its software keeps them because they come from JP [6]. Second, the USP chapter scopes its compliance range for monograph identification as 3800 to 650 cm-1 unless a monograph says otherwise [3]. Ph. Eur. records reference spectra between 4000 and 650 cm-1 [1]. If one method file serves both markets, scan the wider range.
The dispersive column still matters
If your laboratory still runs a grating instrument, Ph. Eur. gives it its own limits. On a monochromator instrument the wavenumber tolerances are ±1.5 (3060.0), ±2.0 (2849.5), ±1.5 (1942.9) and ±1.0 cm-1 for the remaining four bands. Resolution is a percentage-transmittance difference greater than 18 between 2870 and 2849.5 cm-1, and greater than 10 between 1589 and 1583 cm-1 [1]. Do not copy these limits into an FTIR record.
FTIR calibration standards: the polystyrene film and its certificate
Ph. Eur. calls for a polystyrene film of approximately 35 µm and words the wavenumber check permissively: the scale “may be verified” with it [1]. In practice auditors expect a traceable film with its own certificate. Most traceability chains lead back to the NIST SRM 1921 series. The current certificate, SRM 1921b, describes a matte-finish film of approximately 38 µm. Its values are certified at a nominal 23 °C, over 540 to 3125 cm-1, and valid until 31 December 2026 [2].
| Ph. Eur. band, cm-1 | NIST SRM 1921b, band minimum (vacuum), cm-1 | Stated uncertainty, cm-1 | FT tolerance, Ph. Eur. |
|---|---|---|---|
| 3060.0 | 3060.16 | 0.25 | ±1.0 |
| 2849.5 | 2849.48 | 0.49 | ±1.0 |
| 1942.9 | 1942.97 | 0.66 | ±1.0 |
| 1601.2 | 1601.29 | 0.10 | ±1.0 |
| 1583.0 | 1582.98 | 0.09 | ±1.0 |
| 1154.5 | 1154.50 | 0.20 | ±1.0 |
| 1028.3 | 1028.27 | 0.33 | ±1.0 |
NIST values are from Table 4 (band-minimum method) of the SRM 1921b certificate [2]. The 1942.97 cm-1 band is certified only by the band-minimum method, which is new for 1921b.
Three certificate details catch laboratories out:
- The certificate has an expiry. The SRM 1921b values are stated valid until 31 December 2026 [2]. A commercial film traceable to it carries its own certificate and its own recertification date. Log that date in the instrument file, the same way you would for a qualified working standard.
- Resolution and apodisation are part of the certified method. NIST certifies its values at instrument resolutions up to 4 cm-1, with boxcar (no) apodisation at 4 cm-1, and asks for at least six transmittance spectra [2]. Ph. Eur. leaves resolution and apodisation to the manufacturer’s prescription [1]. Write the settings you actually use into the SOP, so every check runs under the same conditions.
- Temperature is specified. The NIST values are given at 23 °C, and the certificate supplies temperature coefficients for use outside 18 to 28 °C [2]. A laboratory in an Indian summer without air conditioning is outside that window.
How the FTIR works, and what each calibration check actually tests
A Fourier-transform instrument does not scan wavelength by wavelength. A Michelson interferometer splits and recombines the infrared beam while one mirror moves. The detector records an interferogram, and the software converts it to a spectrum by Fourier transformation. This design is why the polystyrene check is a check of the whole optical and software chain, not of one component. Tap a component to see its function and the check that exposes a fault in it.
Tap a component
Each part of the optical path shows its function here, the calibration check that detects a fault in it, and the typical failure.
| Component | Function | Check that exposes a fault | Typical failure (engineering, not compendial) |
|---|---|---|---|
| IR source | Emits broadband mid-infrared radiation | Low energy or interferogram amplitude at the start-up diagnostic | Ageing emitter, weak signal, noisy spectra |
| Beamsplitter | Divides the beam between the two mirrors and recombines it | Energy check; resolution pairs losing depth | Humidity damage to hygroscopic optics |
| Fixed and moving mirrors | Create the optical path difference that encodes every wavenumber | Resolution test (0.33 and 0.08 absorbance differences) | Misalignment after transport or shock |
| HeNe reference laser | Tracks moving-mirror position, which sets the wavenumber axis | Wavenumber accuracy at the seven polystyrene bands | Laser ageing, axis shift or failed initialisation |
| Sample compartment and purge | Holds film, KBr disc or ATR accessory | Water vapour and CO2 bands in the background | Exhausted desiccant, open lid, dirty ATR crystal |
| Detector | Converts the modulated beam into an electrical signal | Noise level and energy at start-up diagnostics | Saturation, cooling faults on cooled detectors |
Failure modes are general service experience, not pharmacopoeial text. Use your instrument manual’s diagnostics for the numerical energy and noise limits.
Ph. Eur. also provides for compensating water vapour and atmospheric carbon dioxide on FT instruments [1]. Compensation is not a substitute for a dry compartment. A polystyrene check run against a wet background tells you more about the desiccant than about the instrument.
Which test set applies to your instrument?
Pick your sampling mode and the pharmacopoeia your products are released against. The verdict gives you the test set to write into your SOP and the point an auditor will check first.
1. How is the instrument used for release testing?
2. Which pharmacopoeia governs the product?
Choose one option from each group
The verdict names the wavenumber and resolution tests that apply, and the first thing an auditor looks for.
Wavenumber and resolution checker
Enter the band positions your instrument reports for the polystyrene film, and the absorbance values for the two resolution pairs. The checker applies the tolerances of the pharmacopoeia you select. It works entirely in your browser and stores nothing.
Resolution inputs: absorbance for Ph. Eur., USP and IP FT sets; %T trough depth or %T difference for the JP and monochromator sets.
The USP row uses ±1.0 cm-1 as reported by Agilent [4], and USP sets no resolution test there, so the resolution result is informative only for USP. The checker supports your record. It does not replace the instrument software’s validated calculation.
SOP: calibration and operation of FTIR spectrophotometer
Two linked documents follow. The first is the performance verification (calibration) SOP. The second is the routine operation SOP that this page originally carried, rewritten so it no longer depends on one software version. Adapt the header fields to your document control system. Instrument-specific steps should follow your manufacturer’s manual, for example the Shimadzu IRSolution workflow or its equivalent. For the UV-Vis equivalent, see our UV-Visible spectrophotometer SOP and qualification guide.
1. Purpose
To verify, at defined intervals, that the FTIR spectrophotometer meets pharmacopoeial requirements for wavenumber accuracy and resolution before use for identification testing.
2. Scope
Applies to FTIR spectrophotometer ID ___ in the QC laboratory, in transmission mode, used for identification of APIs, excipients and finished products. It does not cover near-infrared (NIR) instruments, quantitative IR methods, or ATR-specific performance tests. ATR criteria must be defined separately from the manufacturer’s specification.
3. Responsibility
- Analyst, QC: performs the verification and records raw data.
- Officer / Executive, QC: reviews the record, and labels the instrument “Calibrated” or “Out of calibration”.
- Head, Quality Assurance: approves this SOP and any deviation investigation.
4. Materials and equipment
- Certified polystyrene film, approx. 35 µm, traceable to NIST SRM 1921 series, within its certificate validity
- FTIR spectrophotometer with validated software and an audit trail enabled
- Desiccant or dry purge supply for the sample compartment
- Lint-free tissue; powder-free gloves (do not touch the film surface)
5. Procedure
6. Acceptance criteria
| Parameter | Limit (FT, transmission) | Basis |
|---|---|---|
| Wavenumber, 7 polystyrene bands | ±1.0 cm-1 each | compendial Ph. Eur. 2.2.24, Table 2.2.24.-1 [1] |
| Resolution, 2870 / 2849.5 cm-1 | ΔA > 0.33 | compendial Ph. Eur. 2.2.24 [1] |
| Resolution, 1589 / 1583 cm-1 | ΔA > 0.08 | compendial Ph. Eur. 2.2.24 [1] |
| JP: 3060.0, 2849.5, 1942.9 cm-1 | ±1.5 cm-1 | secondary JP 2.25 as summarised by Agilent [4] |
| JP resolution (trough depth) | ≥ 18 %T; ≥ 12 %T | secondary JP 2.25 via Agilent [4] |
| JP reproducibility | Wavenumber under 5 (3060), under 1 (1028) cm-1; %T under 0.5 | secondary JP 2.25 via Agilent [4] |
| IP 2.4.6 | Apply current IP text | check source Agilent reports Ph. Eur.-equivalent limits [4]; the IP text was not available for review |
| ATR accessory | Manufacturer specification | site policy no compendial ATR limits in Ph. Eur. 7.0 [1] |
7. Frequency
- Start-up diagnostic and background: each day of use site policy
- Polystyrene wavenumber and resolution check: at the interval fixed by QA from usage and trend history, commonly monthly or quarterly site policy
- Additionally: after any service, laser or source replacement, relocation, or failed system suitability site policy
No compendial frequency exists in the texts reviewed [1] [5]. Record the rationale for the interval you choose in the instrument qualification file.
8. Precautions
- Never clean the polystyrene film with solvent, and never touch the measurement area. Scratched or creased films shift bands.
- Do not run the check with an exhausted desiccant. Water vapour bands near the 1583 to 1601 cm-1 region can distort peak picking.
- Do not use a film beyond its certificate validity. That is an audit finding even when the numbers pass.
- Do not edit the spectrum (baseline, smoothing) before peak picking unless the SOP specifies it. Audit trail entries will show it.
9. Deviation handling
- If any criterion fails, repeat once after re-running the background and checking the film seating. Record both results; do not overwrite the first.
- If the repeat fails, label the instrument “Out of calibration – do not use” and inform the QC Officer.
- Raise an incident report. Assess the impact on results generated since the last passing check, and list the batches tested.
- Call the service engineer. After repair, repeat the full verification before release to use.
10. Annexures
Annexure-I: FTIR calibration record (see the third tab). Annexure-II: film certificate copy. Annexure-III: start-up diagnostic printout.
11. Revision history
| Version | Date | Change | Approved by |
|---|---|---|---|
| 00 | DD-MMM-YYYY | New SOP | Head QA |
| 01 | DD-MMM-YYYY | FT tolerances aligned to Ph. Eur. Table 2.2.24.-1; frequency marked as site policy | Head QA |
1. Purpose
To lay down the procedure for operating the FTIR spectrophotometer for identification of materials by comparison with a reference substance or a reference spectrum.
2. Scope
Applies to routine identification testing on FTIR ID ___ in the QC department. It does not cover performance verification, which is covered by the calibration SOP.
3. Responsibility
- QC Chemist: operation and data recording.
- QC Manager: review, and accountability for the result.
4. Procedure
5. Recommended distribution
Quality Control (controlled copy); Quality Assurance (master copy).
Annexure-I: FTIR calibration record
Instrument ID: ______ Film certificate No. / valid until: ______ Resolution / apodisation: ______ Lab temperature: ______
| Band (cm-1) | Tolerance (cm-1) | Observed (cm-1) | Deviation (cm-1) | Result |
|---|---|---|---|---|
| 3060.0 | ±1.0 | |||
| 2849.5 | ±1.0 | |||
| 1942.9 | ±1.0 | |||
| 1601.2 | ±1.0 | |||
| 1583.0 | ±1.0 | |||
| 1154.5 | ±1.0 | |||
| 1028.3 | ±1.0 | |||
| Resolution A(2870) – A(2849.5) | greater than 0.33 | |||
| Resolution A(1589) – A(1583) | greater than 0.08 | |||
| Done by / date | Checked by / date | Next due |
Copies as tab-separated text that pastes straight into Excel or Google Sheets.
Equipping or upgrading a QC laboratory?
An FTIR is one line in a QC instrument list that also has to satisfy Schedule M, your target markets’ pharmacopoeias and a qualification plan. Laafon Galaxy’s plant setup cost calculator gives an indicative budget for the QC laboratory alongside the rest of the facility, so you can scope instruments before you request quotations.
Frequently asked questions
Two parameters, both measured on a polystyrene film of about 35 micrometres. The wavenumber scale is checked at 3060.0, 2849.5, 1942.9, 1601.2, 1583.0, 1154.5 and 1028.3 cm-1, within plus or minus 1.0 cm-1 each on an FT instrument. Resolution is checked as absorbance differences greater than 0.33 (2870 against 2849.5 cm-1) and greater than 0.08 (1589 against 1583 cm-1).
None of the pharmacopoeial texts reviewed here states an interval. Ph. Eur. 2.2.24 gives none, and The International Pharmacopoeia says only that instruments should be checked frequently. Monthly or quarterly polystyrene checks, plus a check after every service, are common site policies. Your SOP should record the interval as site policy with its rationale.
No. According to Agilent’s 2020 compliance review, USP chapter 854 requires wavenumber accuracy within plus or minus 1.0 cm-1 on polystyrene bands but sets no resolution test, and does not require more than one wavenumber. Ph. Eur. tabulates seven bands and adds two resolution tests. The USP text is subscription-only, so confirm against your current USP-NF.
Not directly. The tabulated values are transmission values for a free film, and ATR band positions shift slightly. Ph. Eur. 7.0 sets no ATR performance criteria, so laboratories use manufacturer-defined ATR positions and limits and record them as site policy in the SOP.
A certified polystyrene film of about 35 micrometres, traceable to the NIST SRM 1921 series, is the standard used for Indian Pharmacopoeia chapter 2.4.6 as well as Ph. Eur., USP and JP, according to Agilent’s summary. Keep the film certificate in the instrument file and do not use the film beyond its validity date.
Repeat once after a fresh background and checking film seating and desiccant, keeping both results. If it fails again, tag the instrument out of calibration, raise an incident, assess results since the last passing check, and repeat the full verification after service before releasing the instrument to use.
Related on Laafon
References
- European Directorate for the Quality of Medicines and HealthCare. 2.2.24. Absorption spectrophotometry, infrared (01/2008:20224). In: European Pharmacopoeia. 7th ed. Strasbourg: Council of Europe; 2010. Available from: https://www.drugfuture.com/Pharmacopoeia/EP7/DATA/20224E.PDF. Also reproduced as British Pharmacopoeia 2012, Appendix II A: https://www.drugfuture.com/Pharmacopoeia/BP2012/data/1016.html. Accessed September 2026.
- National Institute of Standards and Technology. Certificate of Analysis, Standard Reference Material 1921b: infrared transmission wavelength/wavenumber standard (polystyrene film). Gaithersburg (MD): NIST; 2025. Available from: https://tsapps.nist.gov/srmext/certificates/1921b.pdf. Accessed September 2026.
- United States Pharmacopeia. General Chapter <854> Mid-Infrared Spectroscopy. In: USP–NF. Rockville (MD): USP. doi:10.31003/USPNF_M3208_04_01. Available from: https://doi.usp.org/USPNF/USPNF_M3208_04_01.html (public preview of the introduction). Accessed September 2026.
- Agilent Technologies. Pharmaceutical analysis using FTIR: compliance with European, US, Indian, and Japanese Pharmacopoeia. White paper 5994-2339EN. Santa Clara (CA): Agilent; 2020. Available from: https://www.agilent.com/cs/library/whitepaper/public/whitepaper-pharmacopeia-ftir-5994-2339en-agilent.pdf. Accessed September 2026.
- World Health Organization. 1.7 Spectrophotometry in the infrared region. In: The International Pharmacopoeia. 13th ed. Geneva: WHO; 2025. Available from: https://digicollections.net/phint/pdf/b/7.1.7.1.7-Spectrophotometry-in-the-infrared-region.pdf. Accessed September 2026.
- Shimadzu Corporation. European Pharmacopoeia 5.0: FTIR technical support note. Kyoto: Shimadzu; 2006. Available from: https://www.shimadzu.com/an/service-support/technical-support/ftir/tips_and_tricks/euro_pharmacopoeia5.html. Accessed September 2026.
This procedure is a template for adaptation. It requires local qualification, validation and Quality Assurance approval before use, and every acceptance criterion must be verified against the current pharmacopoeial edition applicable at your site. Ph. Eur. figures above were read from the 7th edition text; USP, JP and IP figures marked secondary or check source were not read from the chapter itself. Pharmacopoeial texts and Indian statutory instruments change between editions. Technical and educational content only, not medical, legal or investment advice.