
A UV-Visible spectrophotometer is released for GMP use through four documented stages — design, installation, operational and performance qualification — and it is the operational qualification that carries the numbers most analysts are looking for: wavelength accuracy, control of absorbance, photometric linearity, limit of stray light and resolution power.
The qualification of UV Visible Spectrophotometer instruments in an Indian QC laboratory is where two pharmacopoeias quietly disagree. Ph. Eur. 2.2.25 permits ±1 nm in the ultraviolet and ±3 nm in the visible range; USP allows ±1 nm and ±2 nm. On the toluene resolution test the published minimum ratio is 1.3 under USP and 1.5 in the Indian and British texts, while Ph. Eur. 2.2.25 declines to fix a universal figure at all and refers you to the monograph.[1] This page gives every limit with its source, and a full SOP template underneath.
Qualification of UV Visible Spectrophotometer: the four stages
Analytical instrument qualification is not a single event and it is not the same thing as calibration. EU GMP Annex 15, in force since 1 October 2015, defines four documented verifications that run from purchase specification through to routine release, and its glossary wording is worth quoting because auditors use it verbatim.[3]
Calibration sits inside installation qualification in the Annex 15 scheme — clause 3.9 lists “calibration of instrumentation” as an IQ deliverable — and then recurs as a periodic check thereafter. A laboratory that files a calibration certificate and calls the instrument qualified has completed roughly one clause of four.
Design qualification
Annex 15 glossary: “the documented verification that the proposed design of the facilities, systems and equipment is suitable for the intended purpose.” Clause 3.3 requires demonstrated compliance with GMP and verification that the user requirement specification is met during design.[3]
For a UV-Visible spectrophotometer this is the stage where the URS commits to the things that cannot be retro-fitted: single beam against double beam, the wavelength range needed for the monographs the laboratory actually runs, the spectral bandwidth, whether a variable slit is required, and whether the software has to satisfy audit-trail expectations. Buying first and writing the URS afterwards is the most common finding in this section.
Installation qualification
Annex 15 glossary: “the documented verification that the facilities, systems and equipment, as installed or modified, comply with the approved design and the manufacturer’s recommendations.” Clause 3.9 requires verification of correct installation against specification, collection of supplier documentation, calibration of instrumentation, and verification of materials of construction.[3]
- Model, serial number, firmware and software version recorded against the purchase order.
- Environment verified: bench stability, temperature and humidity within the manufacturer’s stated range, no direct sunlight on the sample compartment, mains supply and earthing.
- Lamp hours logged from zero for both the deuterium and the tungsten-halogen source.
- Certificates for the reference materials that OQ will use — holmium filter or solution, neutral-density filters, certified potassium dichromate.
- Cuvette set identified, matched and recorded; quartz confirmed for work below 340 nm.
Operational qualification
Annex 15 glossary: “the documented verification that the facilities, systems and equipment, as installed or modified, perform as intended throughout the anticipated operating ranges.” Clause 3.11 requires tests that confirm operation as designed and that establish upper and lower operating limits and worst-case conditions.[3]
This is the stage that carries the five pharmacopoeial parameters in the next section. The phrase that matters in current practice is fitness for purpose: the revised USP chapter expects qualification at the wavelengths and absorbance range the laboratory actually works in, not against a generic factory specification.[5] An instrument qualified only at 257 nm is not qualified for an assay run at 210 nm.
Performance qualification
Annex 15 glossary: “the documented verification that systems and equipment can perform effectively and reproducibly based on the approved process method and product specification.”[3]
For a spectrophotometer, PQ is the ongoing demonstration that the instrument still does the laboratory’s own work: periodic performance verification against the OQ parameters, plus the in-use system suitability checks run with each analytical batch. The EDQM OMCL network splits exactly this way — periodic and motivated instrument checks at one level, in-use checks at another, with repeatability and resolution named as the in-use system suitability parameters.[2]
The five OQ acceptance limits, side by side
The table below is the reason this page exists. Where two pharmacopoeias state different figures, both are shown with their attribution rather than one being presented as settled — a habit worth keeping, because a limit copied from a blog into an SOP and then quoted back to an inspector is a documented specification the laboratory now owns.
| Parameter | Test material | Acceptance limit | Basis |
|---|---|---|---|
| Wavelength accuracy | Holmium perchlorate solution, holmium filter, or deuterium and mercury emission lines | ±1 nm UV ±3 nm visible |
compendial Ph. Eur. 2.2.25 [1] |
| Wavelength accuracy | Certified holmium, didymium or cerium filter | ±1 nm 200–400 nm ±2 nm 400–780 nm SD not more than 0.5 nm |
compendial USP general chapter on UV-Vis spectroscopy [4][7] |
| Control of absorbance | 57.0–63.0 mg potassium dichromate R in 0.005 M sulphuric acid | see wavelength table below | compendial Ph. Eur. 2.2.25 [1] |
| Photometric accuracy | Potassium dichromate solution, or neutral-density glass filter | ±0.010 A below 1.0 A ±1.0 % above 1.0 A filters: ±0.008 A below 1.0 A |
compendial USP, per manufacturer compliance guidance [6][7] |
| Photometric repeatability | Same materials, six replicate measurements | SD not more than 0.005 A below 1 A not more than 0.5 % above 1 A |
compendial USP [4][6] |
| Photometric linearity | Three or more levels across the working range | R² not less than 0.999 | compendial Ph. Eur.; withdrawn as a separate USP test in the December 2022 revision [4][6] |
| Limit of stray light | 12 g/L (1.2 % w/v) potassium chloride R, 1 cm cell, water reference | absorbance greater than 2.0 at 198 nm | compendial Ph. Eur. 2.2.25 [1] |
| Resolution power | 0.02 % V/V toluene R in hexane R, hexane reference | ratio A269 / A266 not less than 1.3 (USP) not less than 1.5 (IP / BP) monograph value (Ph. Eur.) |
check source sources disagree — see below [1][5] |
| Spectral bandwidth | Instrument setting, verified against the method | 2 nm or less is sufficient for most analyses | compendial USP, as reported in review [5] |
| Calibration interval | — | no compendial figure | site policy set by the QMS — see frequency |
Swipe the table sideways on a phone. Rows badged site policy are internal convention, not a pharmacopoeial requirement; rows badged check source are where published sources genuinely differ and the applicable monograph decides.
Wavelength accuracy
Ph. Eur. 2.2.25 lists the calibration lines in its Table 2.2.25.-1, drawn from holmium perchlorate solution, a mercury vapour arc and the deuterium discharge lamp. The holmium maxima quoted in the chapter include 241.15 nm and 287.15 nm, with mercury lines at 253.7, 302.25, 313.16, 334.15, 365.48, 404.66, 435.83 and 579.07 nm, and the holmium line at 361.5 nm.[1] The deuterium lamp’s own emission lines at 486.0 and 656.1 nm are the ones most built-in self-tests use.
A figure worth correcting
The value 240.15 nm circulates widely on Indian pharma sites — including, until this revision, on this page — as the first holmium maximum. The Ph. Eur. 2.2.25 table gives 241.15 nm. A one-nanometre transcription error inside a tolerance of ±1 nm is not a rounding difference: it can turn a passing instrument into a documented failure, or the reverse.
Control of absorbance
Dissolve 57.0 to 63.0 mg of potassium dichromate R in 0.005 M sulphuric acid and dilute to 1000.0 mL for the four ultraviolet wavelengths; the 430 nm check uses the more concentrated solution made up to 100.0 mL. Report specific absorbance A(1 %, 1 cm).
| Wavelength | Specific absorbance A(1 %, 1 cm) | Permitted range | Note |
|---|---|---|---|
| 235 nm | 124.5 | 122.9 to 126.2 | Ph. Eur. |
| 257 nm | 144.5 | 142.8 to 146.2 | check source an upper limit of 145.7 is widely published for IP and BP |
| 313 nm | 48.6 | 47.0 to 50.3 | Ph. Eur. |
| 350 nm | 107.3 | 105.6 to 109.0 | check source an upper limit of 108.2 is widely published for IP and BP |
| 430 nm | 15.9 | 15.7 to 16.1 | Ph. Eur. more concentrated solution |
Values transcribed from the Ph. Eur. chapter text consulted for this page. Two rows carry a lower published upper limit in Indian and British sources; verify against the edition your site is contracted to before writing either figure into an SOP.
Photometric linearity
Ph. Eur. expects a coefficient of determination not less than 0.999 across the levels tested.[4] USP took a different route: the December 2022 revision removed linearity as a standalone requirement, on the reasoning that an instrument meeting the photometric accuracy criterion at the limits of its working range has already demonstrated the property linearity was testing for.[6] A laboratory working to both texts keeps the linearity check; it costs one extra dilution series and closes the gap.
Limit of stray light
Stray light is radiation reaching the detector at wavelengths outside the band the monochromator is supposed to be passing. It compresses high absorbance readings toward the baseline, so its practical effect is that a genuinely out-of-specification sample reads as passing. Ph. Eur. 2.2.25 states that the absorbance of a 12 g/L solution of potassium chloride R in a 1 cm cell “increases steeply between 220 nm and 200 nm and is greater than 2.0 at 198 nm” against water.[1]
Note the wavelength. Many Indian SOPs — including the earlier version of this one — specify the reading at 200 nm rather than 198 nm, and record it across 198 to 202 nm. USP admits a wider set of cut-off materials for the same purpose: sodium iodide or potassium iodide near 220 nm, acetone near 300 nm and sodium nitrite near 340 nm, with the same expectation that measured absorbance exceeds 2.0.[7] Choose the material whose cut-off sits nearest your working wavelength; a stray-light result at 198 nm says very little about an assay run at 340 nm.
Resolution power: what 0.02 % toluene in hexane actually determines
This is the single most-searched detail on the whole topic, and it has a clean answer: a 0.02 % V/V solution of toluene in hexane, scanned against a hexane blank, is used to determine the instrument’s resolution power — in practice its effective spectral bandwidth. The measurement is the ratio of the absorbance at the maximum near 269 nm to the absorbance at the minimum near 266 nm. A wide slit smears the fine vibrational structure of the toluene band, the valley at 266 nm fills in, and the ratio falls.
What it is not is a test of wavelength accuracy or of photometric accuracy, which is the most common confusion in interview questions and in draft SOPs.
Why the acceptance ratio differs between texts
Ph. Eur. 2.2.25 does not publish a universal figure. Its wording is that “the minimum ratio of the absorbance at the maximum at 269 nm to that at the minimum at 266 nm is stated in the monograph” — the general chapter defines the method and the individual monograph sets the number.[1] The USP chapter is reported as accepting a ratio not less than 1.3.[5] Indian and British practice widely publishes not less than 1.5, and that is the figure most Indian QC SOPs carry.
All three can be correct at once, because they are answering slightly different questions. If your method is monograph-driven, the monograph governs. If it is an in-house method, the SOP has to state which text it is following and why — and that statement is what an inspector will ask to see, not the number itself.
Where each test bites: the optical path
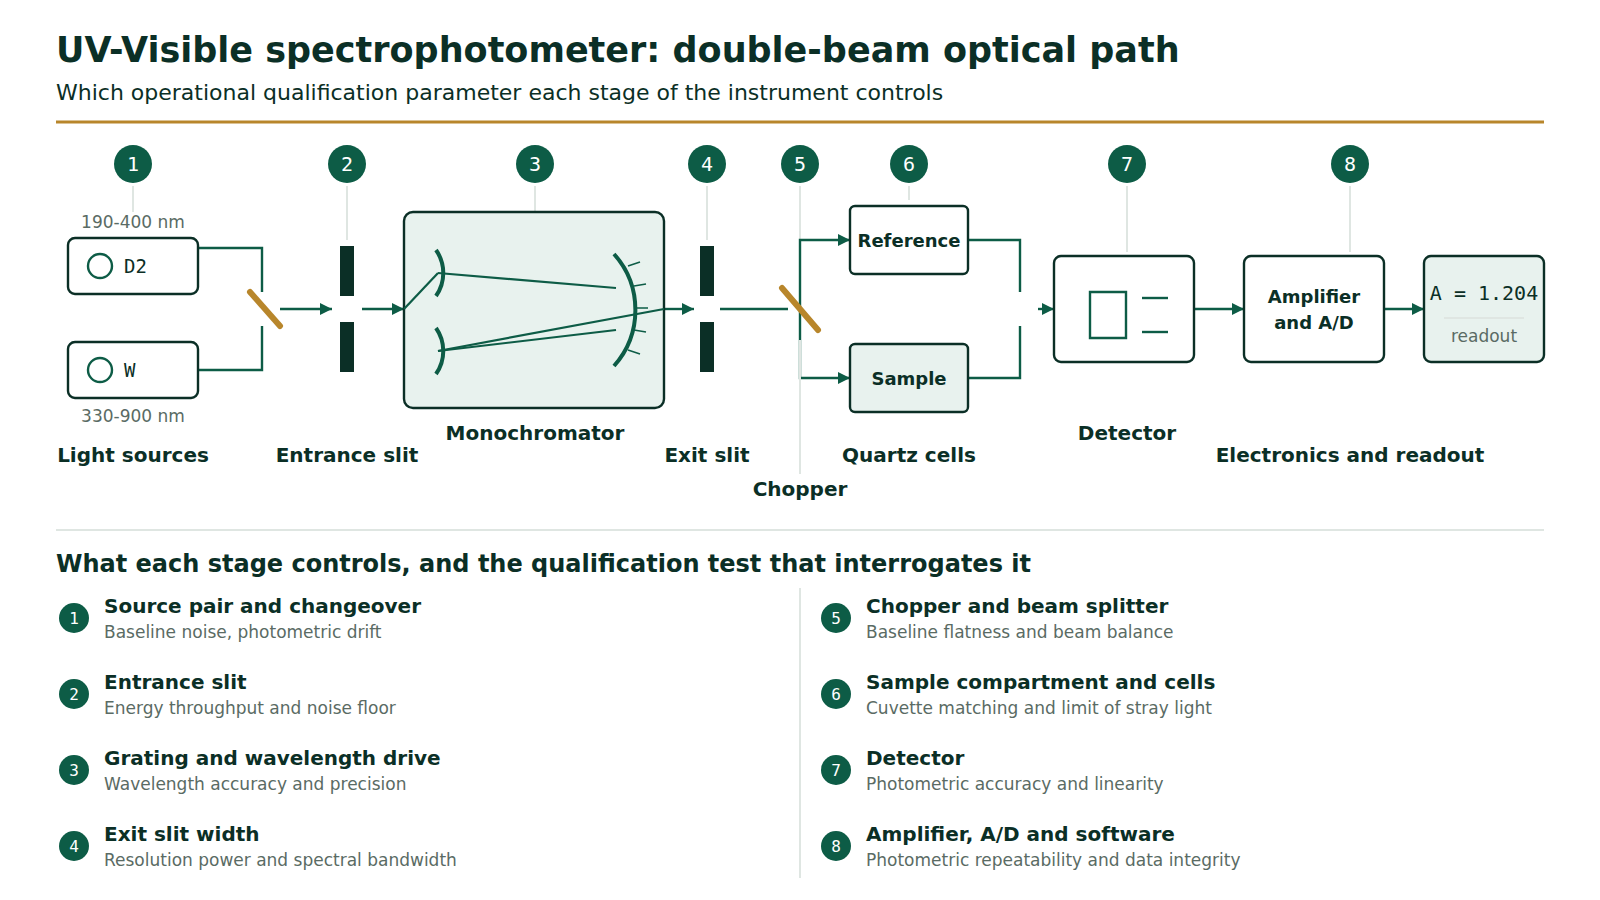
Reading the instrument as a chain rather than a box makes the OQ battery easier to defend. A drifting deuterium lamp shows up as baseline noise, never as a wavelength error. A worn wavelength drive shows up at 241.15 nm, never in the linearity plot. Select a stage below to see what it governs.
Select a stage above
Each of the eight stages is verified by a different qualification test. Tap one to see its function, the parameter it governs and the acceptance limit that applies to it.
Which limit applies to your work
The two questions below decide most of what a UV-Vis qualification protocol has to say. The pharmacopoeia governs the numbers; the purpose of the measurement governs which parameter is critical enough to fail the instrument on.
Choose one option from each group
The verdict names the resolution ratio that applies and the parameter this kind of measurement is most sensitive to.
SOP for UV-Visible spectrophotometer: operation, calibration and periodic check
The template below is written to be adapted. Header fields are deliberately left blank rather than filled with an invented document number, because an SOP number belongs to your quality management system and nobody else’s.
1. Purpose
To describe the procedure for the operation, periodic calibration and performance verification of the UV-Visible spectrophotometer used in the Quality Control laboratory.
2. Scope
This procedure applies to all single-beam and double-beam UV-Visible spectrophotometers installed in the Quality Control laboratory and used for identification, assay, dissolution and limit tests of raw materials, in-process samples and finished products. It does not cover design and installation qualification (covered by the instrument qualification protocol), diode-array detectors integrated into chromatographic systems, near-infrared instruments, or the analytical methods themselves.
3. Responsibility
- Analyst / Chemist, QC: operation, sample measurement, recording of results and immediate reporting of any out-of-limit calibration result.
- Officer, Quality Control: performance of the periodic calibration, preparation of reference solutions, review of the calibration record and lamp-hour log.
- Head, Quality Control: verification of calibration data, initiation of deviation where a criterion is not met.
- Head, Quality Assurance: approval of this SOP, of the calibration schedule and of any deviation or change control arising from it.
- Engineering / Instrumentation: lamp replacement, preventive maintenance and coordination with the external service agency.
4. Materials, equipment and reagents
- UV-Visible spectrophotometer with matched quartz cells of 1 cm path length; glass or disposable cells only above 340 nm.
- Potassium dichromate, analytical reagent grade, dried and of certified purity where available.
- Sulphuric acid, analytical reagent grade, for preparation of 0.005 M solution.
- Potassium chloride, analytical reagent grade.
- Toluene and hexane, spectroscopic grade. Hexane grade matters: an absorbing impurity distorts the 266 nm minimum and lowers the ratio.
- Holmium oxide or holmium perchlorate reference — certified filter or solution, with a valid certificate traceable to a national or international standard.
- Purified water meeting the laboratory’s specification for reagent water.
- Calibrated volumetric glassware, analytical balance and lint-free lens tissue.
5. Procedure: routine operation
6. Procedure: periodic calibration
7. Acceptance criteria
Enter, in the column provided, the single figure your site is contracted to follow. Where a monograph applies, the monograph value overrides anything below.
| Parameter | Published limit | Basis | Site value |
|---|---|---|---|
| Wavelength accuracy | ±1 nm UV; ±3 nm visible (Ph. Eur.) or ±2 nm visible (USP) | compendial [1][6] | |
| Specific absorbance, 235 / 257 / 313 / 350 / 430 nm | 122.9–126.2 / 142.8–146.2 / 47.0–50.3 / 105.6–109.0 / 15.7–16.1 | check source two rows differ in IP and BP [1] | |
| Photometric repeatability | SD not more than 0.005 A below 1 A; not more than 0.5 % above 1 A | compendial USP [6] | |
| Photometric linearity | R² not less than 0.999 | compendial Ph. Eur. [4] | |
| Limit of stray light | greater than 2.0 A at 198 nm (Ph. Eur.) | compendial [1] | |
| Resolution power, A269 / A266 | not less than 1.3 (USP) or 1.5 (IP / BP); monograph value under Ph. Eur. | check source [1][5] | |
| Baseline noise, empty compartment at 500 nm | mean ±0.002 A over 61 measurements | OMCL guidance [2] | |
| Photometric drift at 250 nm over 2 h | ±0.001 A per hour | OMCL guidance [2] | |
| Photometric drift at 500 nm over 60 min | ±0.002 A per hour | OMCL guidance [2] | |
| Spectral slit width | ±10 % of the selected slit width | OMCL guidance [2] | |
| Calibration interval | no compendial figure | site policy justify in the QMS |
8. Precautions and safety
- Hexane and toluene are flammable and toxic by inhalation. Prepare and transfer the resolution solution in a fume hood, and cap the cell during measurement to limit evaporation — evaporation changes the concentration and therefore the ratio.
- Never look into the sample compartment while a deuterium lamp is running with the cover interlock defeated.
- Do not touch the optical faces of a cell. A fingerprint absorbs strongly in the ultraviolet and is a common cause of a spurious stray-light or absorbance failure.
- Do not use glass or disposable plastic cells below 340 nm.
- Record lamp hours at every use. Replacing a lamp is a change that requires re-verification before the instrument returns to routine use.
- Do not overwrite or delete a scan file. Audit-trail and data-integrity expectations apply to spectrophotometer software as they do to chromatography systems.
9. Deviation handling
- Stop analytical use of the instrument immediately and affix an “Under calibration / Do not use” label.
- Verify the obvious assignable causes before declaring a failure: reference material within its expiry, correct blank, clean and correctly oriented cells, adequate warm-up, correct slit and scan settings.
- Where an assignable cause is found and corrected, repeat the affected test only, and record both the original and the repeat result. Do not delete the original.
- Where no assignable cause is found, raise a deviation and notify Quality Assurance.
- Assess the impact on results generated since the last passing calibration. This retrospective assessment is the part most often missing, and it is the part an inspector will ask for.
- Arrange service or lamp replacement, then requalify against the affected parameters before release for routine use.
10. Annexure-I: calibration record
| Parameter | Reference material / lot | Observed | Site limit | Pass / Fail | Done by | Checked by |
|---|---|---|---|---|---|---|
| Wavelength accuracy | ||||||
| Specific absorbance 235 nm | ||||||
| Specific absorbance 257 nm | ||||||
| Specific absorbance 313 nm | ||||||
| Specific absorbance 350 nm | ||||||
| Photometric repeatability | ||||||
| Limit of stray light | ||||||
| Resolution power |
Copies as tab-separated text, so it pastes straight into Excel or Google Sheets as a grid.
11. Annexure-II and III
- Annexure-II: Instrument usage log — date, time in, time out, sample identity, analyst, lamp hours.
- Annexure-III: Lamp replacement and preventive maintenance record — date, lamp type, serial, hours at replacement, re-verification reference.
12. Revision history
| Version | Effective date | Change | Reason |
|---|---|---|---|
| 00 | DD-MMM-YYYY | First issue | New instrument qualified |
| 01 | DD-MMM-YYYY | Acceptance criteria aligned to current pharmacopoeial edition | Periodic review |
Equipping or re-qualifying a QC laboratory
Instrument qualification scope, reference-standard budgets and the laboratory layout that supports them are usually settled at the plant-planning stage, not afterwards. Laafon Galaxy’s pharma plant setup cost calculator gives an indicative breakdown that includes QC laboratory equipping, so the qualification workload is visible before the purchase order rather than after it.
How often, and who decides
There is no compendial calibration interval for a UV-Visible spectrophotometer. This is worth stating plainly, because the intervals published across Indian pharma sites — monthly, quarterly, six-monthly — are presented as though they came from a pharmacopoeia, and they did not. The earlier version of this page said every three months; other widely-read sources say once a month. Both are site policy.
Nothing in the qualification of UV Visible Spectrophotometer equipment fixes a calendar. What the standards actually say is that the interval must be justified. EU GMP Annex 15 clauses 4.1 and 4.2 require equipment to be evaluated periodically to confirm it remains under control, with re-qualification periods justified and evaluation criteria defined.[3] The EDQM OMCL guidance on qualification of UV-Visible spectrophotometers, in force since 1 September 2025, likewise structures the work as periodic and motivated instrument checks without fixing a universal calendar.[2]
A defensible interval is built from the instrument’s own history: how far the last three calibrations drifted from nominal, lamp age, workload, the criticality of the products released on it, and the manufacturer’s recommendation. A laboratory that can show that reasoning in a risk assessment is in a stronger position than one quoting a number it inherited.
Requalification triggers and deviations
Periodic checks are only half of the qualification of UV Visible Spectrophotometer instruments; the other half is event-driven. The following events should trigger requalification of the affected parameters regardless of when the next periodic check falls due — the “motivated” checks in the OMCL scheme.[2]
- Replacement of the deuterium or tungsten-halogen source.
- Replacement or realignment of any optical component, including the grating or a mirror.
- Detector replacement or repair.
- Any service intervention that opens the optical bench.
- Firmware or software upgrade, including a change to the calculation or reporting routines.
- Relocation of the instrument, including a move within the same laboratory.
- An out-of-specification or out-of-trend result traced to the instrument.
- Introduction of a method that works outside the wavelength or absorbance range the instrument was qualified in — the fitness-for-purpose point.
The same discipline applies to the records themselves. Calibration printouts, raw scan files and the reasoning behind a repeat measurement are all GMP records; the expectations set out for ALCOA and ALCOA+ data integrity apply to spectrophotometer software as much as to a chromatography data system, and a laboratory that treats scan files as disposable has a finding waiting for it.
UV-Visible spectrophotometer models used in Indian QC labs
Instrument choice is a design-qualification decision, so it belongs with the URS rather than with the purchase order. The models below are those commonly encountered in Indian quality control laboratories. This is an observation of what is in use, not a recommendation, and no ranking is implied or intended.
| Manufacturer | Models commonly seen | Configuration | DQ consideration |
|---|---|---|---|
| Shimadzu | UV-1800, UV-1900i, UV-2600i, UV-3600i | Double beam | Fixed against variable slit differs across the range; check against the resolution requirement of your monographs |
| Agilent | Cary 60, Cary 8454 | Xenon flash; diode array | Diode-array optics change how spectral bandwidth and stray light are verified |
| Systronics | UV-166, UV-2201 | Single and double beam | Confirm the qualification support and reference-material package available locally |
| LabIndia | UV 3092 and related | Double beam | Confirm software audit-trail capability against your data-integrity policy |
| Trulab India | T700 Vis Pro | Visible range | A visible-only instrument cannot serve ultraviolet monographs; check the wavelength range in the URS |
Model availability and specifications change. Verify the current configuration and the wavelength range against the manufacturer’s datasheet before writing either into a user requirement specification.
Frequently asked questions
It is used to determine the resolution power of the spectrophotometer, which in practice means its effective spectral bandwidth. The solution is scanned against a hexane blank and the ratio of the absorbance at the maximum near 269 nm to the absorbance at the minimum near 266 nm is calculated. It is not a test of wavelength accuracy or of photometric accuracy.
Both figures are published, by different texts. USP is reported as accepting a ratio of not less than 1.3, while Indian and British practice widely publishes not less than 1.5. Ph. Eur. 2.2.25 sets no universal figure at all and states that the minimum ratio is given in the individual monograph. Where a monograph applies to your method, the monograph value governs; where it does not, the SOP must state which text the laboratory is following.
Calibration compares the instrument’s response against a reference of known value and adjusts or documents the difference. Qualification is the wider documented exercise that establishes the instrument is suitable for its intended purpose across design, installation, operation and performance. EU GMP Annex 15 places calibration of instrumentation inside installation qualification, at clause 3.9, so the qualification of UV Visible Spectrophotometer instruments contains calibration as one of its deliverables rather than being replaced by it.
No pharmacopoeia sets a universal interval. Monthly, quarterly and six-monthly intervals are all in common use in Indian laboratories, and all of them are site policy. What EU GMP Annex 15 requires, at clauses 4.1 and 4.2, is that the interval be justified and the evaluation criteria defined. Build the justification from calibration drift history, lamp age, workload, product criticality and the manufacturer’s recommendation.
Ph. Eur. 2.2.25 states the criterion at 198 nm: the absorbance of a 12 g/L potassium chloride solution in a 1 cm cell against water is greater than 2.0 at that wavelength. Many Indian SOPs record the reading at 200 nm, or across the 198 to 202 nm span, which is a stricter reading of the same steeply rising edge. Either can be defended provided the SOP states the wavelength and the source it follows.
Yes, for the affected parameters. A source change alters energy throughput and therefore the noise floor, and it can shift baseline and drift behaviour. Verify wavelength accuracy, photometric accuracy, baseline noise and drift before returning the instrument to routine use, and record the lamp serial number and the hours at replacement against the re-verification reference.
Related on Laafon
- Liquid filling machine validation: DQ, IQ, OQ, PQ — the same four-stage scheme applied to production equipment.
- Principle of HPLC: system suitability limits and SOP — the chromatographic counterpart to this instrument.
- Karl Fischer calibration: factor limits and DST SOP — another QC instrument where the acceptance limit is the whole argument.
- Gas chromatography: principle, instrumentation and residual solvents
- Calibration of FTIR — the infrared equivalent of the checks on this page.
- Pharmaceutical method validation — what the qualified instrument is then used to prove.
- All SOP and calibration procedures on Laafon
References
- European Pharmacopoeia. Chapter 2.2.25, Absorption spectrophotometry, ultraviolet and visible. Chapter text consulted for the values on this page. Available from: https://www.drugfuture.com/Pharmacopoeia/EP7/DATA/20225E.PDF. Accessed September 2026. Verify against the current edition in force at your site.
- European Directorate for the Quality of Medicines and HealthCare. PA/PH/OMCL (19) 100 R2 — Qualification of UV-Visible Spectrophotometers. Entry into force 1 September 2025. Available from: https://www.edqm.eu/documents/52006/128968/omcl-annex-3-qualification-of-uv-visible-spectrophotometers.pdf. Accessed September 2026.
- European Commission. EudraLex Volume 4, Annex 15: Qualification and Validation. Effective 1 October 2015. Available from: https://health.ec.europa.eu/system/files/2016-11/2015-10_annex15_0.pdf. Accessed September 2026.
- Agilent Technologies. Compliance with USP and European Pharmacopoeia requirements for UV-Vis spectrophotometers. Application note. Available from: https://www.agilent.com/cs/library/applications/application_pharmacopeia_uv-vis_cary3500-5994-1188en_us_agilent.pdf. Accessed September 2026.
- Spectroscopy. Is your spectrophotometer still pharma compliant? A review of the latest USP chapter. Available from: https://www.spectroscopyonline.com/view/your-spectrophotometer-still-pharma-compliant-review-latest-usp-chapter. Accessed September 2026.
- Mettler-Toledo. UV Vis spectrophotometer calibration explained. Available from: https://www.mt.com/gb/en/home/applications/Application_Browse_Laboratory_Analytics/uv-vis-spectroscopy/uv-vis-calibration.html. Accessed September 2026.
- Hellma. United States Pharmacopeia calibration standards for UV-Vis spectrophotometry. Available from: https://www.hellma.com/en/calibration-standards/united-states-pharmacopeia-usp. Accessed September 2026.
This procedure is a template for adaptation. It requires local qualification, validation and Quality Assurance approval before use, and every acceptance criterion must be verified against the pharmacopoeial edition in force at your site. Pharmacopoeial texts and Indian statutory instruments change between editions, and the general chapter numbering used above may differ in the edition you hold. Where this page shows two published figures for the same parameter, that reflects a genuine difference between sources and not an editorial preference. Technical and educational content only; not medical, legal or investment advice.